|
bar chart Example 1
bar chart Example 2 line chart Example 3 line chart Example 4 pie chart Example 5 pie chart Example 6 |
|
Live Example Graphic Tools Invisible Counter |
PIECHART Generator
|
|
|
to download this graphic to your harddrive: right-click chart and 'Save Image As...' chart.png |
|
|
| Make piechart. Make pie chart - create piechart online tool piechart graph without applet pie graph creation make a pie graph image for your report |
|
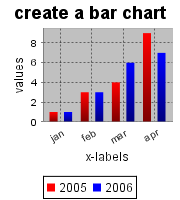
Bar Charts, like line charts, are useful for comparing classes or groups of data. A simple bar chart has one data serie, but you can add more data series. Earch data serie can be shown in a different color. Pie charts can only have one data serie. The labels (X values) must be unique and semi-colon-separated (ex: 1;2;3;4;5;6;7;8;9;10 or jan;feb;mar;apr;may;jun) The corresponding data (Y values) must be numerical and semi-colon-separated( ex: 23;25.6;19;17;23;33;48.9 ) You can switch from bar charts to line charts with the same set of data. The charts are created with JFreeChart JFreeChart is a popular open source Java charting library that can generate most common chart types, including pie, bar, line, and Gantt charts. In addition, the JFreeChart API supports many interactive features, such as tool tips and zooming. JFreeChart provides an excellent choice for developers who need to add charts to Swing- or Web-based applications. |
| Make piechart. Make pie chart - create piechart online tool piechart graph without applet pie graph creation make a pie graph image for your report |
|
Use of cookies on this website (more info) |
|


